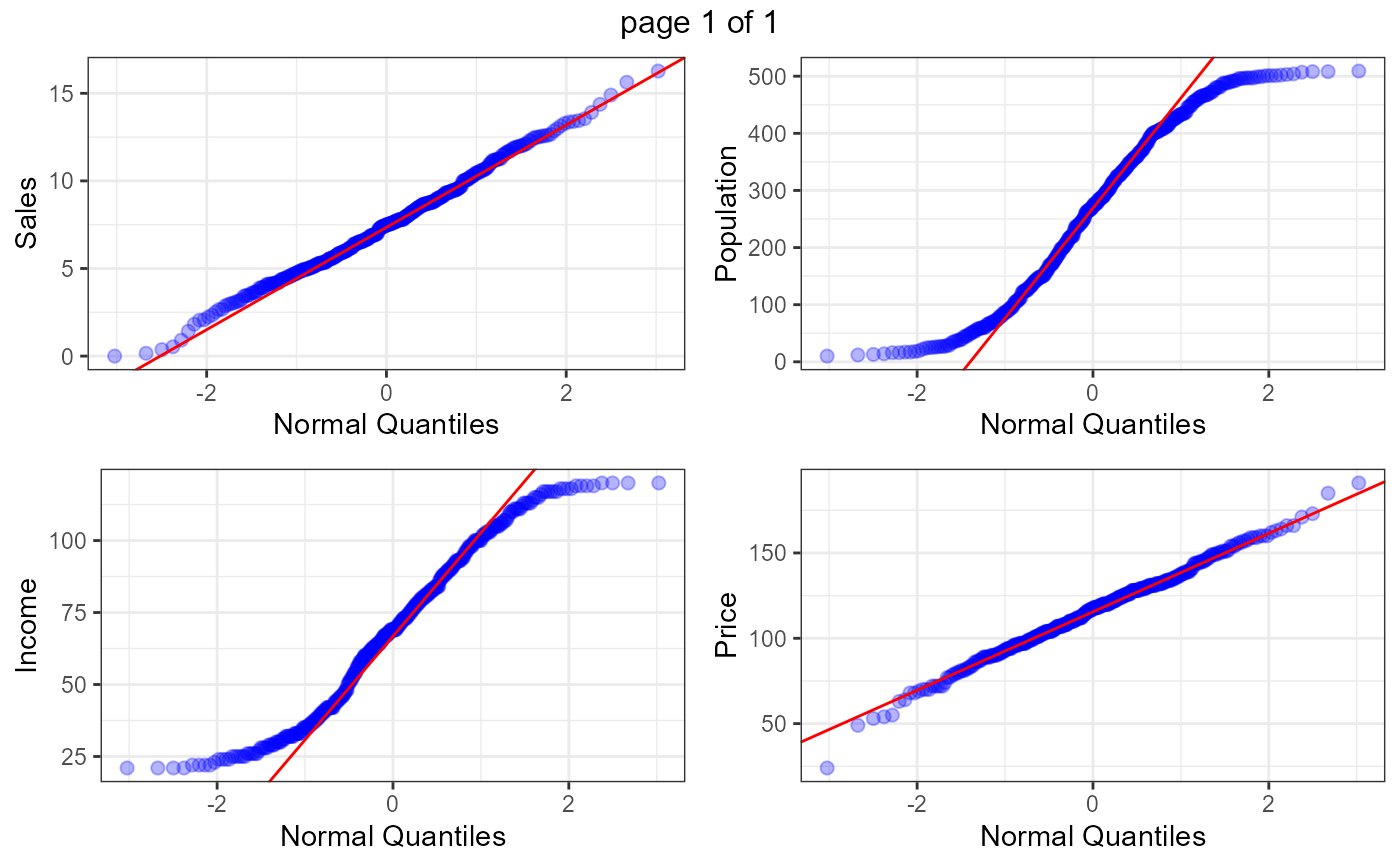
This function automatically scans through each variable and creates normal QQ plot also adds a line to a normal quantile quantile plot.
ExpOutQQ(data, nlim = 3, fname = NULL, Page = NULL, sample = NULL)
Arguments
| data | Input dataframe or data.table |
|---|---|
| nlim | numeric variable limit |
| fname | output file name. Output will be generated in PDF format |
| Page | output pattern. if Page=c(3,2), It will generate 6 plots with 3 rows and 2 columns |
| sample | random number of plots |
Value
Normal quantile quantile plot
See also
Examples
#> $`0`#>